Every CIPD Level 5 student who fears data analysis encounters a breathing dragon at 5CO02 (Evidence-Based Practice). The module is designed such that in Task One, you jump from AC 1.5 (Question 5) straight to AC 3.1 (Question 6) and AC 3.2 (Question 7). You then revert to AC 2.1 at Question 8 (AC 2.1) in Task Two (Quantitative and Qualitative Analysis Review). AC 2.2 (Question 9) is a derivative of Question 8 while AC 2.3 (Question 10) concludes this Module.
Wise students hire our experienced CIPD level 5 assignment writers for 5CO02 data analysis tasks with us. The rest try going commando during the first submission, but they almost always get a REFER grade. Don’t risk your overall module score or career growth. Join the A+ team – the whole internet admits we’re the go-to guys for help with CIPD 5CO02 data analysis using Excel and Tableau!
Psssssttttt: Other service providers call our 24/7/365 HelpDesk deep in the night whenever they see “Data Analysis” in a CIPD assignment.
What Does Data Analysis in Evidence-Based Practice (EBP) Involve?
Task Two of 5CO02 is not about opinions, it’s about strategic HR decisions backed by evidence. CIPD assessors expect learners to analyse quantitative data (numbers, percentages, trends) alongside qualitative evidence (opinions, feedback, themes) to justify people practice recommendations. Marks are awarded for how well you convert and interpret provided data.
Many CIPD Level 5 apprentices mistake this section for simple data presentation. Your assessor expects a clear link between data patterns, organisational performance, and business outcomes to score you highly. This is why data analysis sits at the core of EBP. Unfortunately, this is where many Level 5 students struggle.
It’s important to state 5CO02 doesn’t test Excel or Tableau directly. It assumes functional data-analysis competence: learners are expected to calculate metrics, visualise trends, and extract evidence-backed insights. Most papers recycle academic theory but few apply analytic skills.
Those we asked said Excel formulas were intimidating and Tableau dashboards felt out of reach. The result? Weak analysis, generic commentary, and lost marks. We bridge the gap and transform your 5CO02 Task Two into a high-scoring, insight-driven, and data-based exercise.
What Do CIPD Assessors Look For in 5CO02 Data Analysis ACs?
From AC 2.1 to AC 2.3, assessors reward raw organisational data interpretation, high-resolution infographics, and feasible recommendations. If staff turnover rises from 12% to 18%, the marking committee expects you to explain why it matters, not reporting figures. Quantitative data shows the assessor patterns. Your qualitative comments explain the causes. For example, an exit survey theme like “lack of progression” at AC 2.3 should validate turnover figures in AC 2.1 for your paper to earn high marks.
All charts and tables in AC 2.2 must be purposeful – a simple bar chart comparing performance ratings is enough only if it’s followed by a narrative paragraph. Also, every recommendation in AC 2.3 must be justified. If you suggest training for example, you must state the benefits (higher productivity), risks (cost / uptake), and financial implications (e.g. £25,000 training expenses vs reduced attrition costs).
Suitable Tools for 5CO02
- Excel handles calculations, pivot tables, and clean charts efficiently
- Tableau takes analysis to the peak through dashboards and trend visualisation, helping stakeholders grasp your insights instantly.
(Read more here)
IMPORTANT NOTES
- Citations are NOT mandatory in the first two ACs of this 1000-word part
- As indicated in the Assignment Brief, Task Two is not bound in any way to the Case Scenario that informs responses in Task One of CIPD 5CO02
Guided Data Analysis for CIPD 5CO02 Using Excel
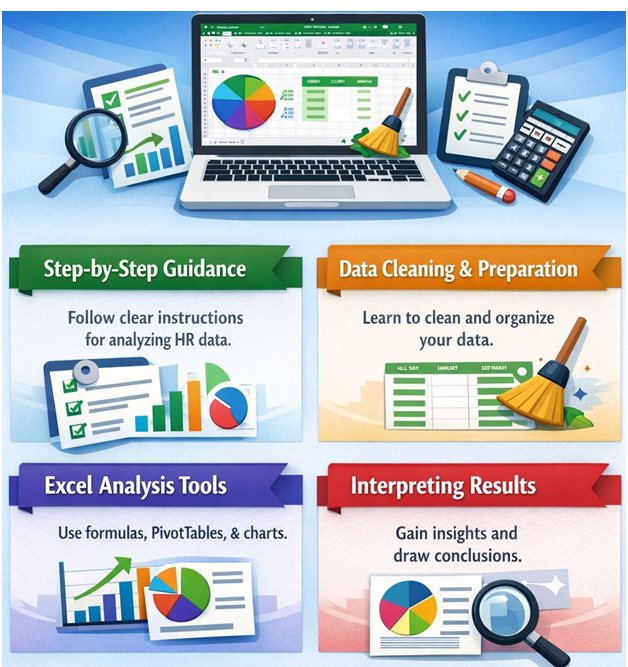
This is where average submissions fail as strong ones pull ahead. Excel is the fastest way to turn raw data into credible evidence. When used correctly in Task Two of 5CO02, it shows assessors you’ve graduated from thinking descriptively and joined the analytical calibre! Here’s a proven process of scoring the coveted High Distinction in the three CIPD 5CO02 Task Two ACs:
❖ Clean and Prepare the Provided Dataset
Start ruthless. Messy data kills insight, and the assessor may deliberately jumble things up to test this. Sort the dataset by role, department, or performance rating to spot early patterns.
❖ Use Excel Formulas & Functions
Now calculate and fill in the blank columns. AC 2.1 calls for percentages in the recently-released CIPD 5CO02 assessment brief (June 2025), so don’t write raw numbers. If 18 out of 120 employees left for example, don’t fill in “18.” Write “15%” under the Turnover column. Use simple formulas – for example:
Turnover % = (Number of leavers ÷ Average headcount) × 100
These are not advanced formulas yet they produce advanced insights when interpreted properly.
❖ Visualise with Excel Charts
AC 2.2 demands at least 3 functional visuals. You could do Column Charts to compare categories clearly and Bar Charts to highlight differences across departments. Pie Charts work best when showing simple proportions, so use them sparingly. One chart = One message. For example, a “Turnover by Department” column chart immediately reveals hotspots and becomes evidence for AC 2.3!
❖ Format the Excel Sheet!
Formatting matters more than many students realise. Label axes clearly. Use meaningful titles like “Employee Turnover by Department (2024)” instead of the boring “Chart 1.” Remove clutter. Gridlines, legends, and colours should support readability but not distract the audience. If an assessor has to guess what your chart shows, you’re deep in REFER territory!
❖ Explain the Figures
Excel does not score you marks by itself, evaluative interpretation does. Every table and chart should be followed by a narrative paragraph(s). What does this mean to the organisation? Why does it matter to people professionals? What decision should HR follow up with? When Excel supports those answers, your 5CO02 submission stops looking like an assignment and sounds like professional people analytics!
Use filters to isolate groups such as leavers versus retained staff. Missing values matter – a blank response in an engagement survey is not “nothing”; it is non-participation. State this clearly in the narrative. For example, “15% of employees did not respond, which may limit representativeness.” That single sentence signals critical thinking and CIPD 5CO02 assessors notice this. For Performance Ratings, convert counts into proportions e.g “42% of staff are rated ‘Meets Expectations’ while only 8% exceed targets.” That comparison creates meaning just as KPIs turn data into decisions.
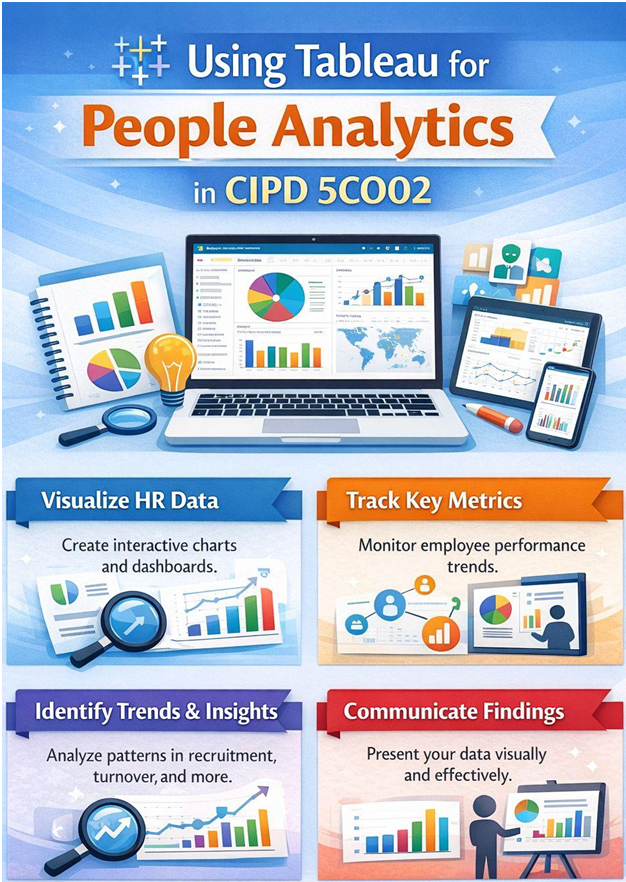
Using Tableau for People Analytics in CIPD 5CO02
“This is where 5CO02 submissions stop tasting like a student script and start reading like an ideal HR analytics brief.”
Although Tableau isn’t a CIPD requirement for Task Two of 5CO02, it separates descriptive work from evidence-driven insight by making patterns impossible to ignore. Excel calculates, but Tableau reveals. Comparison dashboards allow side-by-side views (e.g sales versus operations, new hires versus long-tenured staff) and do what pages of text cannot. They make evidence visible, simultaneously supporting AC 2.1 and AC 2.2’s interpretation and presentation in one swipe.
Importing and Structuring CIPD 5CO02 Data from Excel to Tableau
Tableau works best with Excel’s groundwork. Clean data in Excel directly connects to Tableau in seconds: no coding needed, no complexities! Tableau instantly recognises structured numeric and categorical fields leading to confident insight.
How to Create Interactive Tableau Dashboards
Tableau Dashboards turn static findings into analytical narratives – for example, a heatmap instantly shows which departments drive high absence or have the lowest engagement. A trend line could easily expose whether your organisation’s turnover is stabilising or accelerating.
Best Visuals for Evidence-Based Presentation
Not all visuals are equal. Scatter plots are powerful when testing relationships. For example, plotting participation scores against organisational performance ratings reveal whether high employee engagement correlates with output or demystifies a myth. Tableau dashboards work best when multiple insights support one decision. If the message is single and clear, a clean bar chart beats an overloaded dashboard.
Assessors reward clarity, not complexity. Simple charts still matter!
Combine Excel, Tableau, and Narrative Paragraphs for High Scores!
When Excel builds the foundation and Tableau tells the story, your 5CO02 data analysis section matches EBP expectations of CIPD Level 5. The title promise is fulfilled – you’re no longer reporting data but using it to justify action! That’s the connection students often miss.
However, neither Excel nor Tableau visuals replace explanations. A dashboard showing rising staff absences must be followed by interpretation, risk analysis, and cost implications. Tableau strengthens Excel evidence, turning your paper into indisputable HR decisions. This is where top marks are earned!
Interpreting Results for CIPD 5CO02 Evidence-Based Writing
★ Translate Numbers into Insights
Numbers alone won’t earn you CIPD 5CO02 Task Two marks, meaning does! Clear patterns show organisational direction while trends measure HR’s momentum. Outliers signal risks or opportunity. For example, if one department shows 25% absence while the organisational average is 6%, that gap demands explanation. Is workload higher? Is management weaker?
CIPD 5CO02 assessors expect you to move beyond “what happened” to “why it matters” in Task Two. Strong analysis links data movement directly to people practice performance, productivity, engagement, and retention.
★ Link Data Analysis Results to People Practices
Your data should clearly inform choices around learning investment, performance reviews, workforce planning, or policy changes. When decisions are visibly anchored in analysis, assessors reward the logic. If training spend rises but performance ratings remain flat for example, you should question the company’s HR effectiveness. But if employee engagement scores improve after upskilling line managers, that’s a justifiable intervention with credibility. This is EBP in action, the secret vault stuffed with A+ grades!
★ Write Impactful Findings & Recommendations (AC 2.3)
Lay out the benefits, risks and financial implications of every recommendation in AC 2.3. CIPD assessors hunt for justification not guesswork.
Avoid These Three 5CO02 Data Analysis Submission Errors!
- Data that doesn’t answer the AC question correctly scores poorly
- Weak or absent interpretation (describing charts or presenting diagrams without narrative analysis)
- Not referencing authoritative People Analytics concepts in AC 2.3
Frequently Asked Questions about Help With CIPD 5CO02 Data Analysis
Question: Which analysis tools do you use for HR data analysis in CIPD 5CO02 data analysis?
Answer: Excel and tableau are the most commonly used analytic tools used calculate metrics, visualise trends, and extract evidence-backed insights.
Question: Do you provide assistance in both Task 1 and Task 2
Answer: Yes. Our CIPD assignment help entails handling task 1 and task 2. Task 1 is a briefing paper focused on theory (Evidence-Based Practice, Critical Thinking, Ethics). Task 2 is the practical “Quantitative and Qualitative Review” where you must actually analyze provided data sets and visualize the findings using dashboards or draw insights and themes.
Question: How much do you charge for Task 1 and Task 2
Answer: We charge 150 Pounds for both parts. However, students looking for task 2 assistance, which is help with CIPD 5CO02 data analysis we charge them 80 pounds.